High Wire Act
Even the best run job shops should not underestimate their level of employment paranoia. Sometimes it’s our best people who can get very antsy, very quickly. It doesn’t take much.
In my experience, the more finely-tuned an operation we have, the closer to the edge we are likely to live. Most job shops must:
- Quote aggressively to get the work,
- Squeeze the highest gross margin out of every single job,
- Staff for the “most likely” amount of work (knowing that we will usually be under- or over-staffed),
- Invest in costly equipment and tools to remain competitive… well before we have enough business to truly justify it,
- Pour a massive amount of information into everyone involved, and
- Do the above better than everyone else in the industry.
Sprinkle in a few years of chronic economic pressure and we test even the most resilient co-worker.
To Look Or Not To Look
So if we acknowledge that there is well hidden fear and uneasiness even with good people, good processes, and good business prospects, then we have a choice to make. Do we openly face and discuss the unsettling aspects of our situation or do we shield our employees from the stress and distraction of our business realities so they can focus on their immediate tasks?
I pose this as a viable choice but in truth it is not. Workers have lost their innocence; few are willing to fully commit to organizations unwilling to level with them. Plus, in the absence of actual information, folks assume the worst anyhow. So most progressive job shops tell the truth, the whole truth, and nothing but the truth, whether they are assembling printed circuit boards (pcba’s), building custom airplanes or making deli sandwiches.
The practical question becomes how to quickly convey the shop’s complex status and direction in ways that everyone understands. If I were on a tightrope (not gonna happen), I would have just three urgent demands that would really decide my stress level! Smart job shops figure out how to communicate this information simply and constantly:
- Am I safe and secure right now?
- What can I do to get across my rope (week, month, etc.) safely?
- What upcoming conditions must I deal with?
1-2-3 Go!
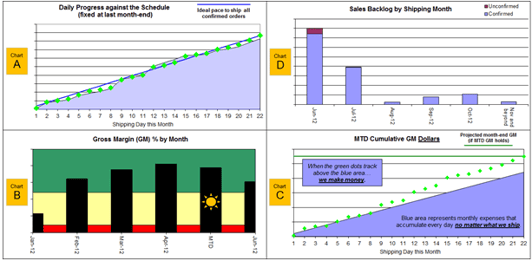
RBB has created a dashboard, published daily by 9:00 a.m., which allows every employee to tell how we are doing and what the near future looks like – while there is still time to change it! Its core content is these four charts. (Real dollar figures are used but have been removed for this publication.) Let me explain.

This was the RBB dashboard on May 31st, 2012. In Chart A, the shaded area shows our planned shipments (USD). Green dots are added daily showing actual results. At a glance we know whether we are ahead or behind schedule. The blue “ideal pace” line reminds us to try to ship the same amount of dollars every day (impossible in a job shop but still a cool goal). Chart A says that in May we stayed very close to schedule and even shipped a few added circuit boards.
Chart B shows the Gross Margin (= price – [material + labor]) of what we are shipping. The MTD (month-to-date) bar is our current status. Simple: Green is best and the higher the better.
Chart C weaves Charts A and B together. Folks understand that gross margin dollars are what we use to pay for the built-in costs of the business. Every morning we see whether our shipment profitability is high enough to cover the fixed costs of the day. If the green dots are above the shaded area on Chart C, we are safely expecting to make money this month. The green line at the top is the projection of monthly profit if we ship everything in the schedule and if the MTD gross margin holds all month. You can see that May was a joy.
Looking ahead then, Chart D shows the actual backlog of booked orders, by month. The pattern here is typical of most job shops: where it looks like demand disappears after the short term. Serious faith that new orders will come in is required (more on this in a future post)! Chart C says that at least June looks busy.
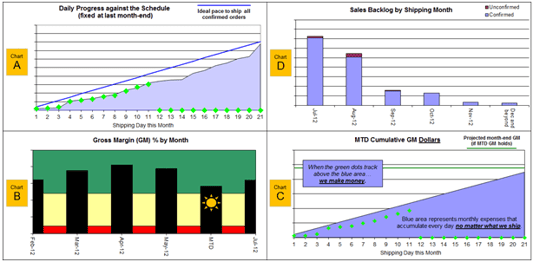
Now fast-forward to mid-June and let’s take another look.

In 5 seconds, we note many things:
- Shipments are on schedule! (Chart A)
- The last day of June will be a VERY busy day. (Chart A)
- So far the gross margin is still in the green but it’s weaker than May. (Chart B)
- At this moment June’s profitability projection looks dicey. (Chart C)
- July’s orders have filled in nicely; August is even looking great. (Chart D)
Bottom line: to finish out June well, we need to make sure everything in the schedule ships and yet do it without raising costs (through overtime, etc.).
And this is the whole point. A simple, powerful dashboard turns every staffer into a business person. Each employee knows what needs to happen to maneuver this month’s tightrope safely. And once we get across, as the new orders dictate, we get to do it all over again.
This ongoing tension is the fun, the thrill, and the stress of the average job shop. Dealing with it as a true team of unified business people – now that’s the real victory. And yeah, it was a squeaker, but we saved June.
Bruce Hendrick has been a leader of major change in corporations and small business alike for the past 25 years; currently he's the owner of RBB Systems and Organizational Development Services, LLC; noted speaker, author, active church member and community volunteer.


